Dashboard
Overview of the ArbitrAI dashboard — your central hub for monitoring evaluation activity.
Overview
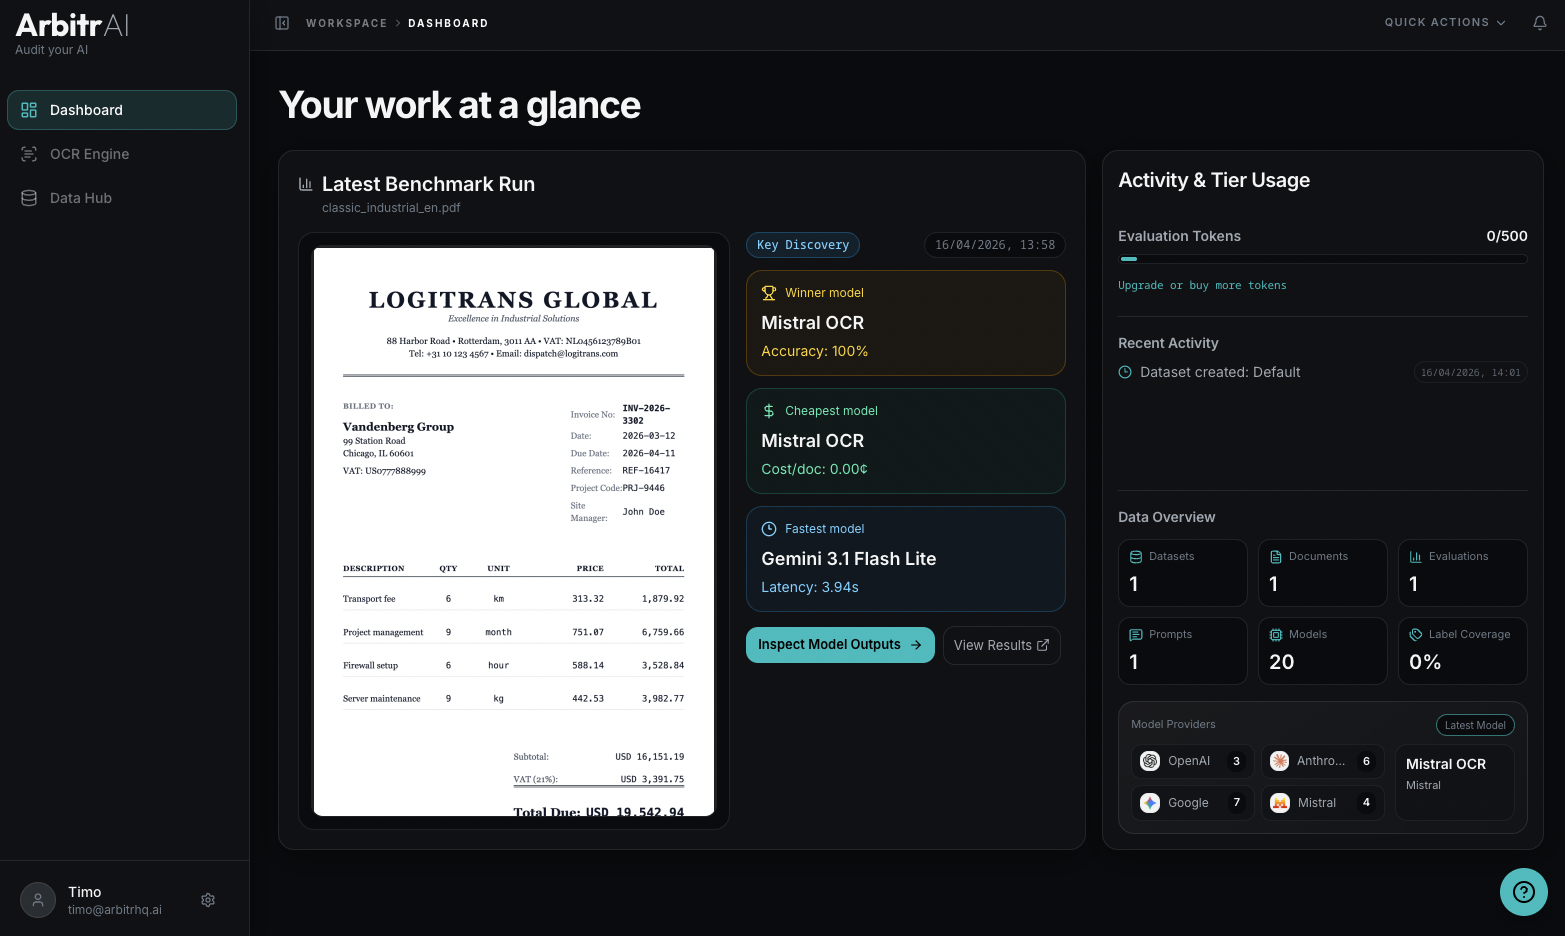
The Dashboard is the first thing you see after logging in. It gives you a quick overview of your workspace’s activity under the heading “Your work at a glance.”
Latest Benchmark Run
The left panel shows your most recent evaluation run with:
- Document preview — a thumbnail of the evaluated document
- Run source — e.g., “Key Discovery” for key abstraction runs
- Created date
- Summary cards highlighting:
- Winner Model — model name and performance
- Cheapest Model — model name and cost per document
- Fastest Model — model name and latency
Two quick actions let you jump directly into results:
- Inspect Model Outputs — opens the detailed per-document comparison view
- View Results — opens the aggregate model comparison table
Usage and Activity
The right panel shows:
Evaluation Tokens
A bar chart displaying your token usage — how many evaluation tokens you’ve used out of your cap, and when the balance resets upon hover. Each token covers 1 document x 1 model x 1 run.
Recent Activity
A chronological timeline of recent events in your workspace:
- Benchmark runs completed
- Ground truth labels updated
- Datasets created
- Documents uploaded
Each event shows what happened and when.
Data Overview
At the right panel, summary counters give you a snapshot of your workspace:
- Datasets — total count
- Documents — total count
- Evaluations — total benchmark runs
- Prompts — saved prompt templates
- Models — configured AI models
- Label Coverage — percentage of documents that have ground truth labels
- Model Providers — breakdown by provider with latest model added