Interpreting Results
Understand evaluation results through the aggregate comparison table, metrics configuration, and detailed per-document model output views.
Overview
After an evaluation run completes, navigate to it from the Evaluation Hub or click View Results from the dashboard. The results view gives you two perspectives: an aggregate overview and a detailed per-document breakdown.
Aggregate View
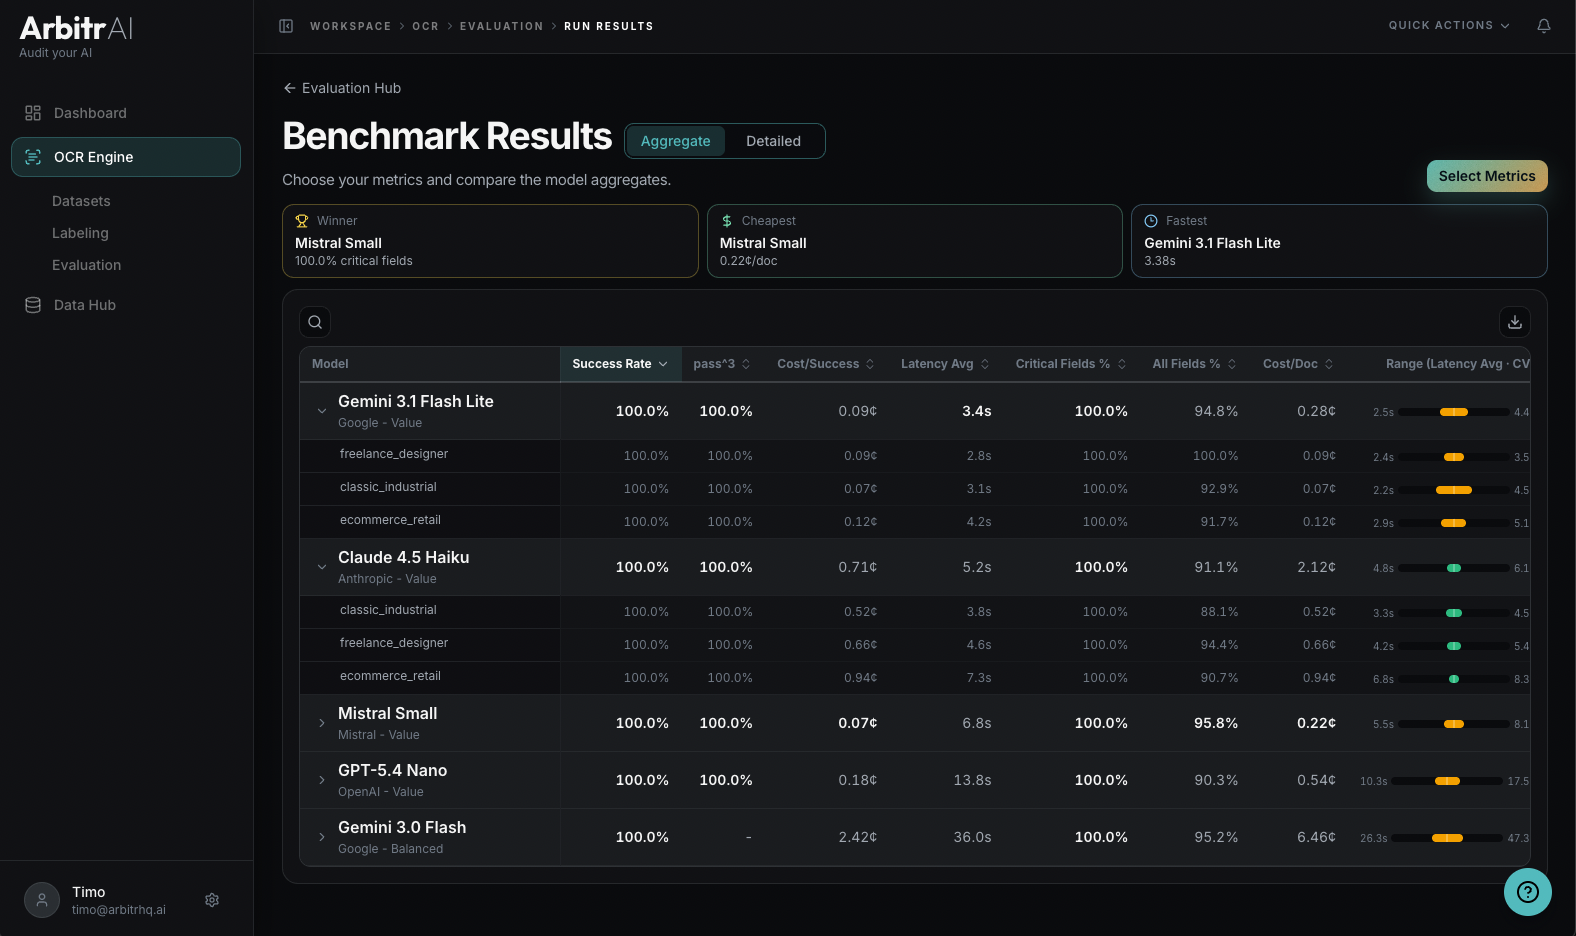
The default view shows an aggregate model comparison table with all evaluated models as rows and metrics as columns. At the top, summary highlights call out:
- Winner Model — heuristic that takes critical fields, total fields, and cost into account.
- Cheapest Model — lowest cost per document
- Fastest Model — lowest latency
Sort by any metric column to quickly identify the best-performing configuration for your specific priority — whether that’s accuracy, cost, or speed.
You can search and filter models in the table, and each metric displays in its appropriate format (percentages, currency, seconds, etc.).
Configure Metrics
Click the Select Metrics button to customize what you see. Available metrics are grouped by domain:
- Performance — output coverage, success rate, % fields correct
- Economics — cost/ document, cost/success
- Reliability — spread/variance metrics like coefficient of variation, standard deviation, and percentiles (P90, P95, P99) — these require 2+ runs per model
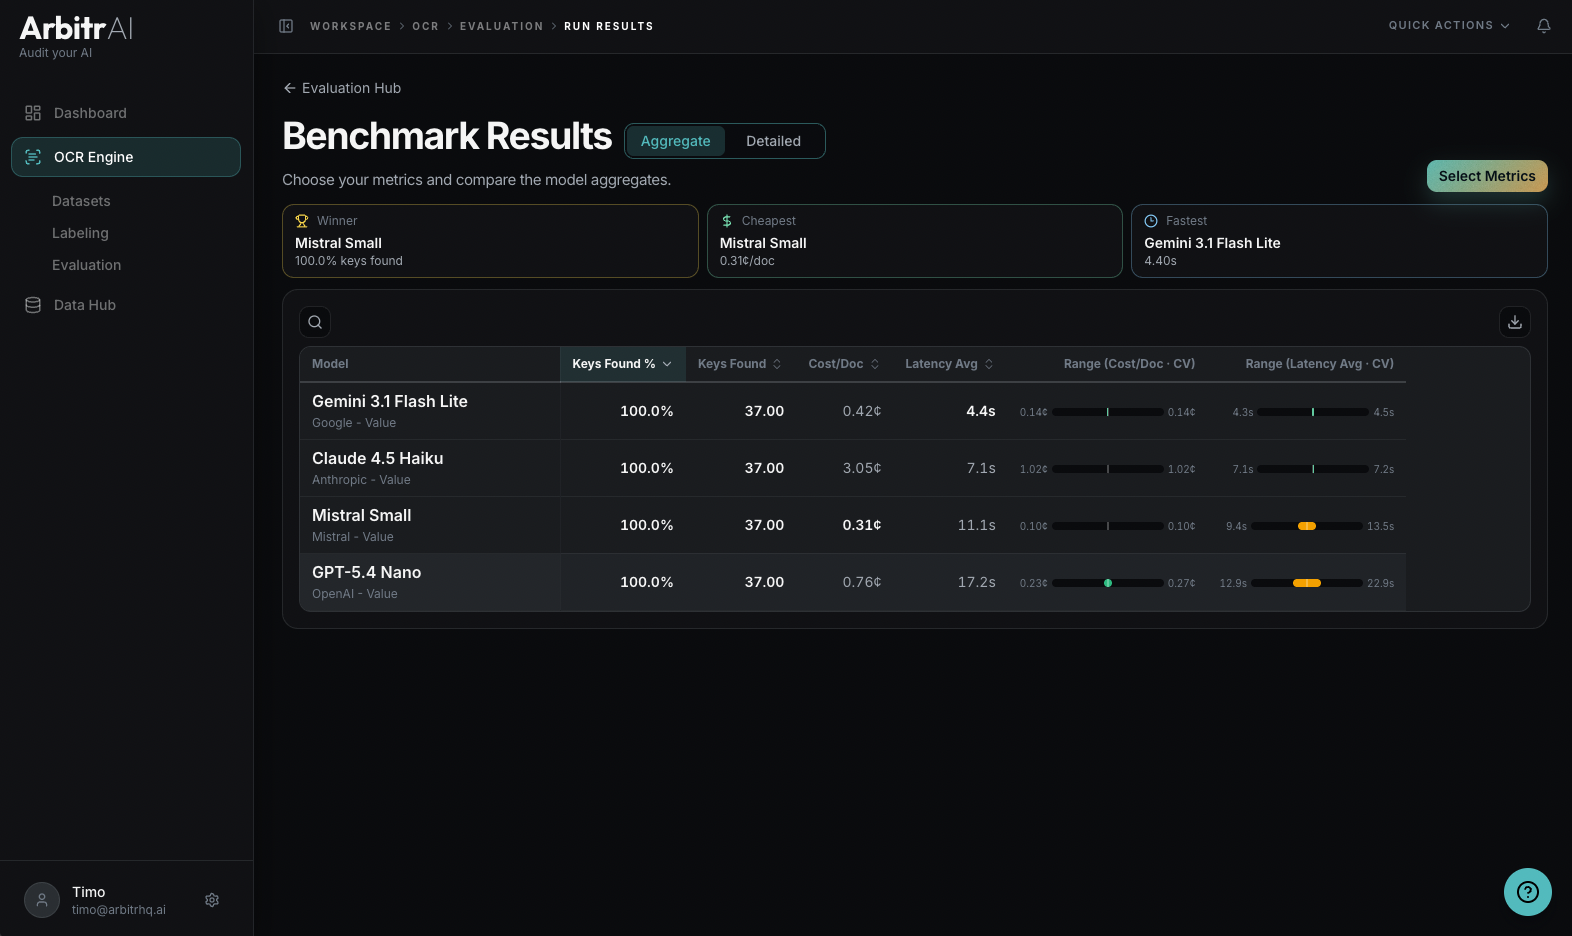
Reliability Range Bars
Toggle the reliability range column to visualize how consistent each model is. Choose a metric and a value mode (CV, Stddev, P90, P95, P99) to see min/max range bars per model. This helps distinguish a model that’s reliably good from one that occasionally performs well but has high variance.
Detailed View: Model vs. Ground Truth
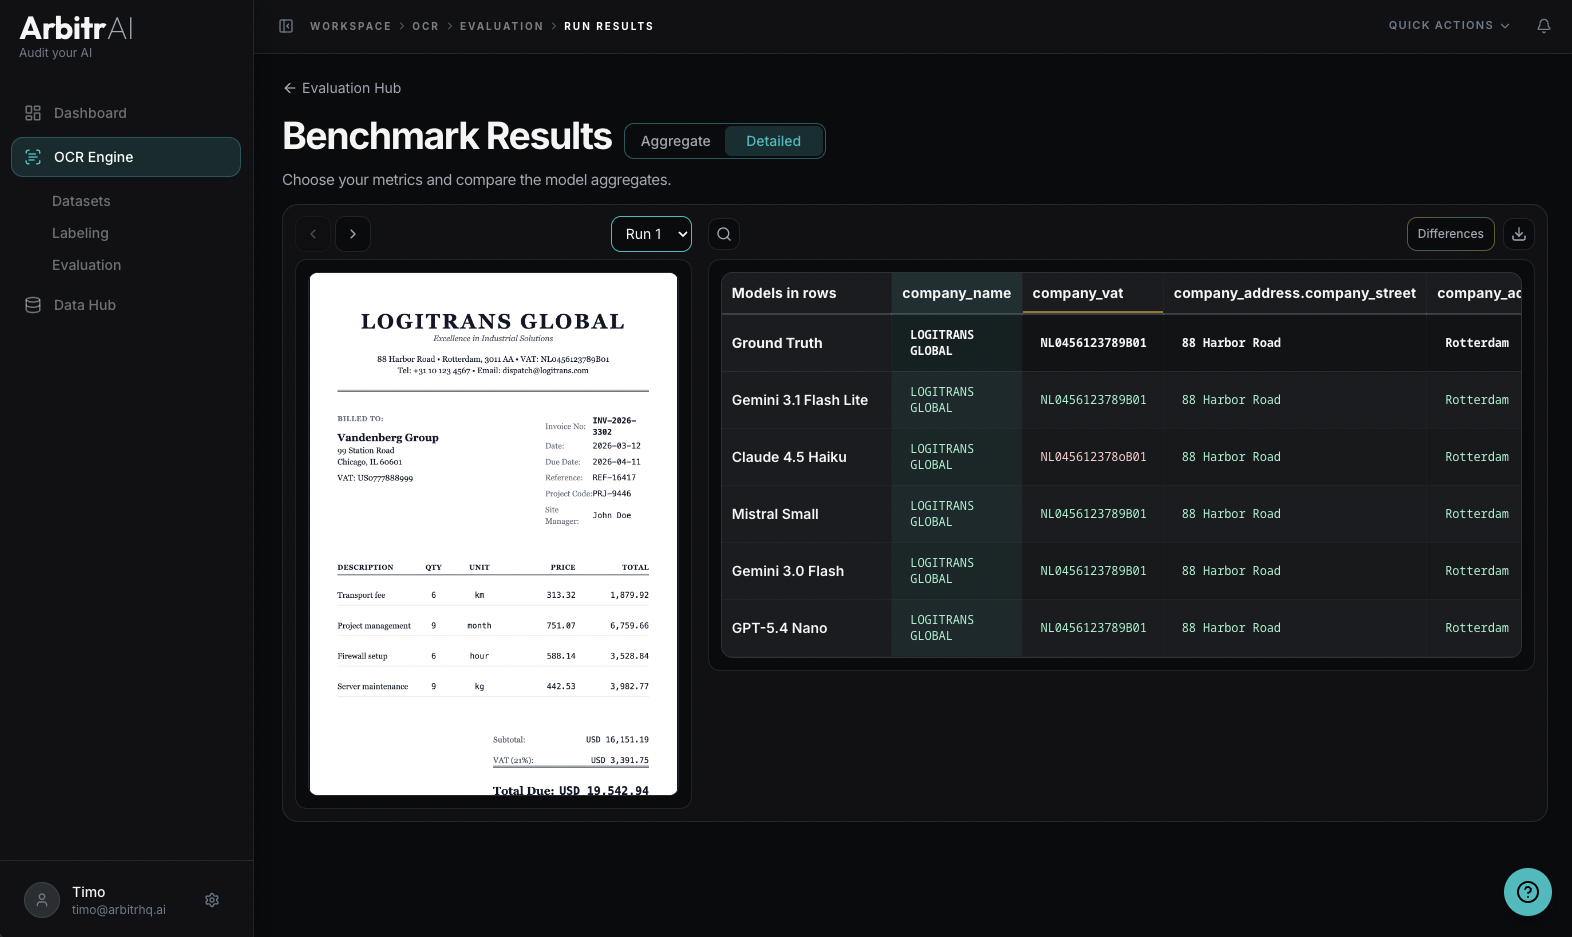
Switch to the detailed view to see exactly what each model extracted compared to your ground truth, document by document.
The Model vs. Ground Truth Comparison shows:
- A matrix with model rows and ground truth keys as columns
- Each cell shows the model’s extracted value vs. the ground truth value
- Click any cell to see the corresponding bounding box highlighted on the document
- Mismatches are colour coded, where the model got it wrong
- To focus on discrepancies, push the differences button
For Key Abstraction runs (without ground truth), the detailed view shows a Model vs. Model Comparison instead, letting you compare outputs across models directly. The Ground Truth row is left empty.
Run Status
Runs can be in different states:
- Completed — fully processed, final results
- Ongoing — still processing; shows progress like “Evaluating Models” and how many models have completed
Tips
- Don’t just look at averages — use the reliability range bars to check score consistency
- Focus on the worst-performing documents first to understand failure modes
- Use the detailed view to identify systematic errors (e.g., a model consistently misreading dates) vs. one-off mistakes
- Toggle “Only Changes” in the detailed view to quickly spot where models diverge from ground truth
- Adjust success criteria to match your real business requirements — 100% accuracy may not be necessary if non-critical fields have some tolerance